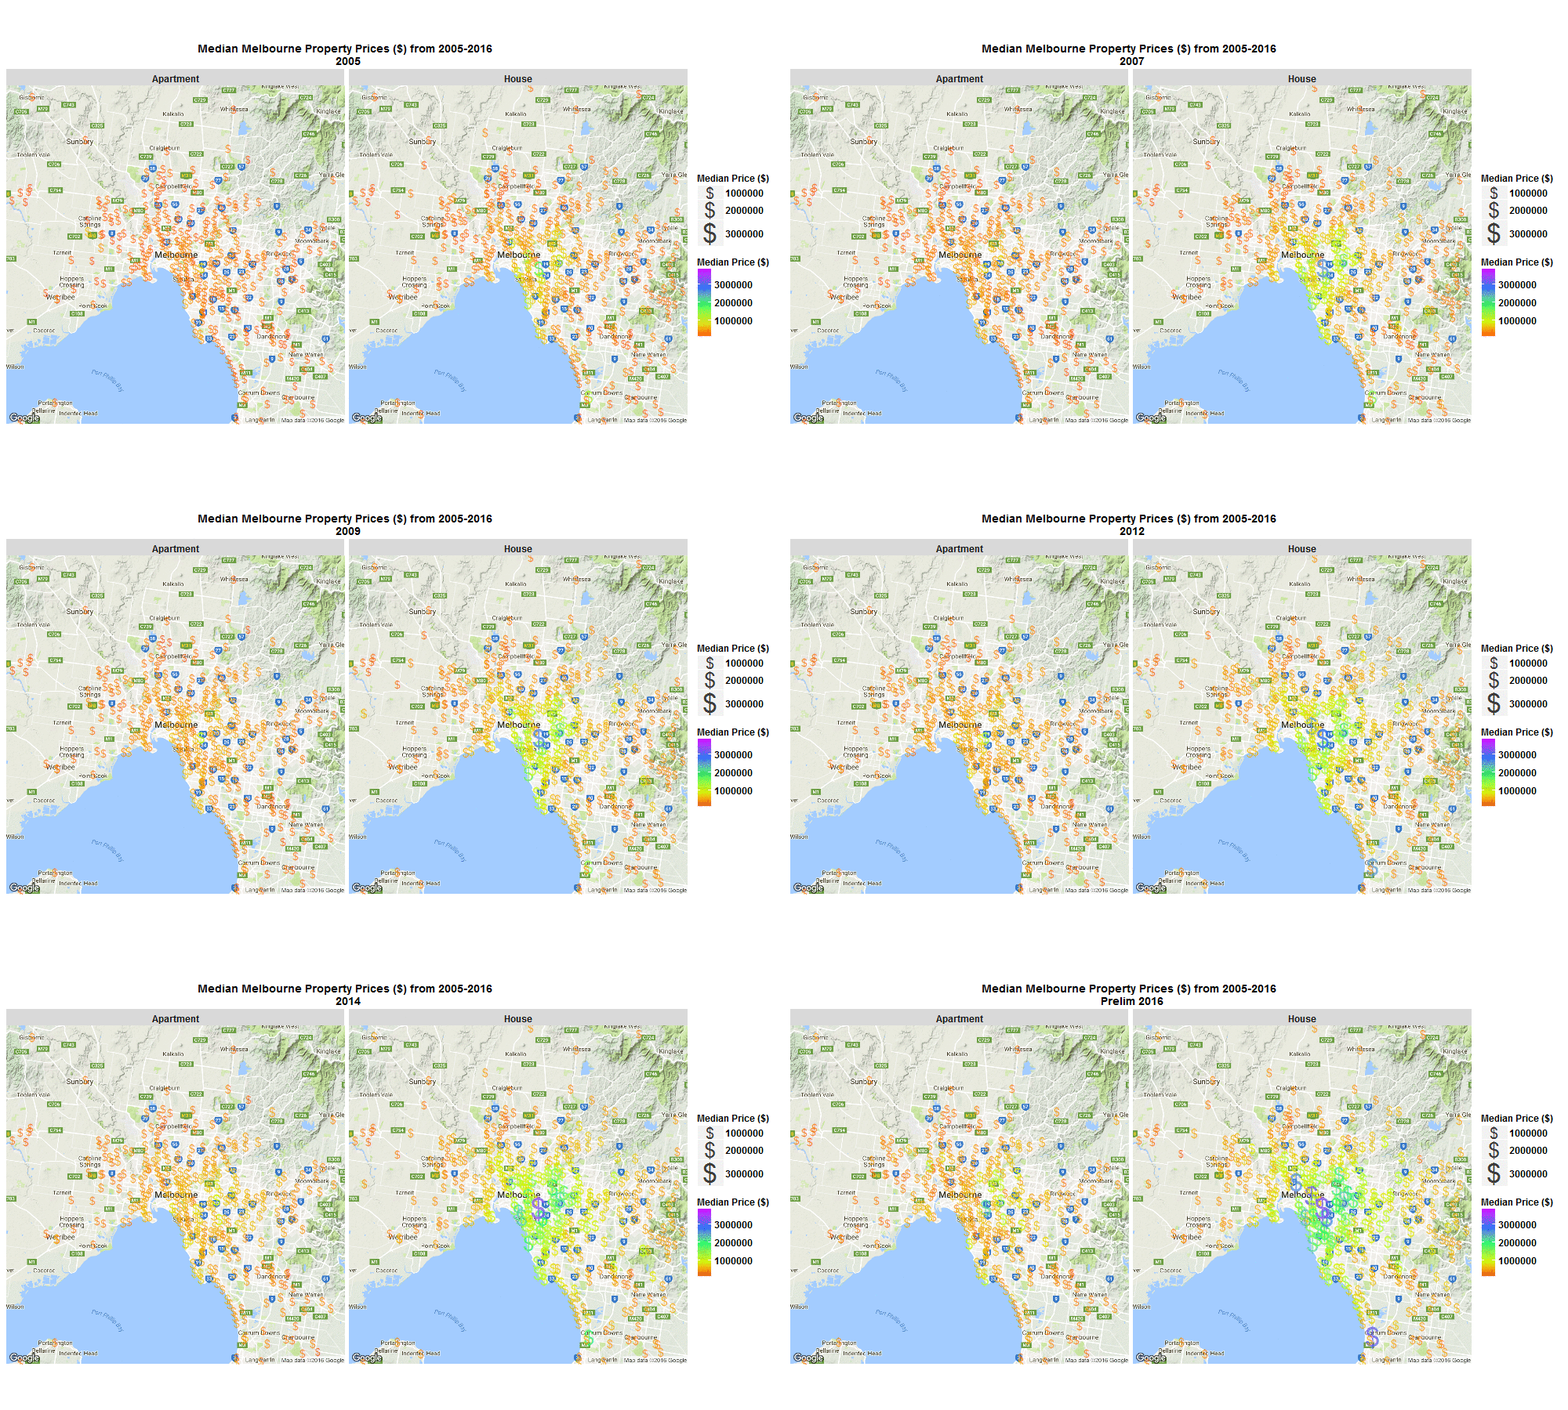
Median Melbourne Property Prices ($) from 2005-2016
29 Sep 2016I stumbled across an interesting raw dataset from Victorian Government, Australia today, It had house and apartment prices in Melbourne, Australia from 2005-March 2016 http://www.dtpli.vic.gov.au/property-and-land-titles/property-information/property-prices
Thought it worth a look…
So I wrote some R code to import the data from excel spreadsheet, tidy it, and then make this animated plot which I think is cool because you can get some insight from it in a much faster than just looking through the raw data in an excel spreadsheet. I thought it was interesting how much faster Houses are going up in value compared to Apartments. Also interesting how most of the price increases are in on the SouthEast side of Melbourne. I will drill into this dataset further when I get time, zooming in to certain suburbs, plotting vacant land over time (also included in the raw data), etc etc.
The R code I used to make the plot below is here
Click the plot to enlarge
