29 Aug 2020
A neat way to hold gold via the ASX and also be impartial AUD/USD exchange rate timing, is to hold a split of half QAU half PMGOLD. I lay out analysis and reasons.
QAU and PMGOLD are ETFs that track the price of gold. The key difference between them is that QAU is hedged back to AUD, so when AUD strengthens QAU does relatively better than PMGOLD. On the other hand, PMGOLD is USD based, so when AUD falls against USD, PMGOLD does relatively better than QAU.
The plot below shows that these gold price tracking ETFs, either hedged to AUD (QAU.AX) or non-hedged (PMGOLD.AX) can perform very differently over time due to AUD/USD movements.
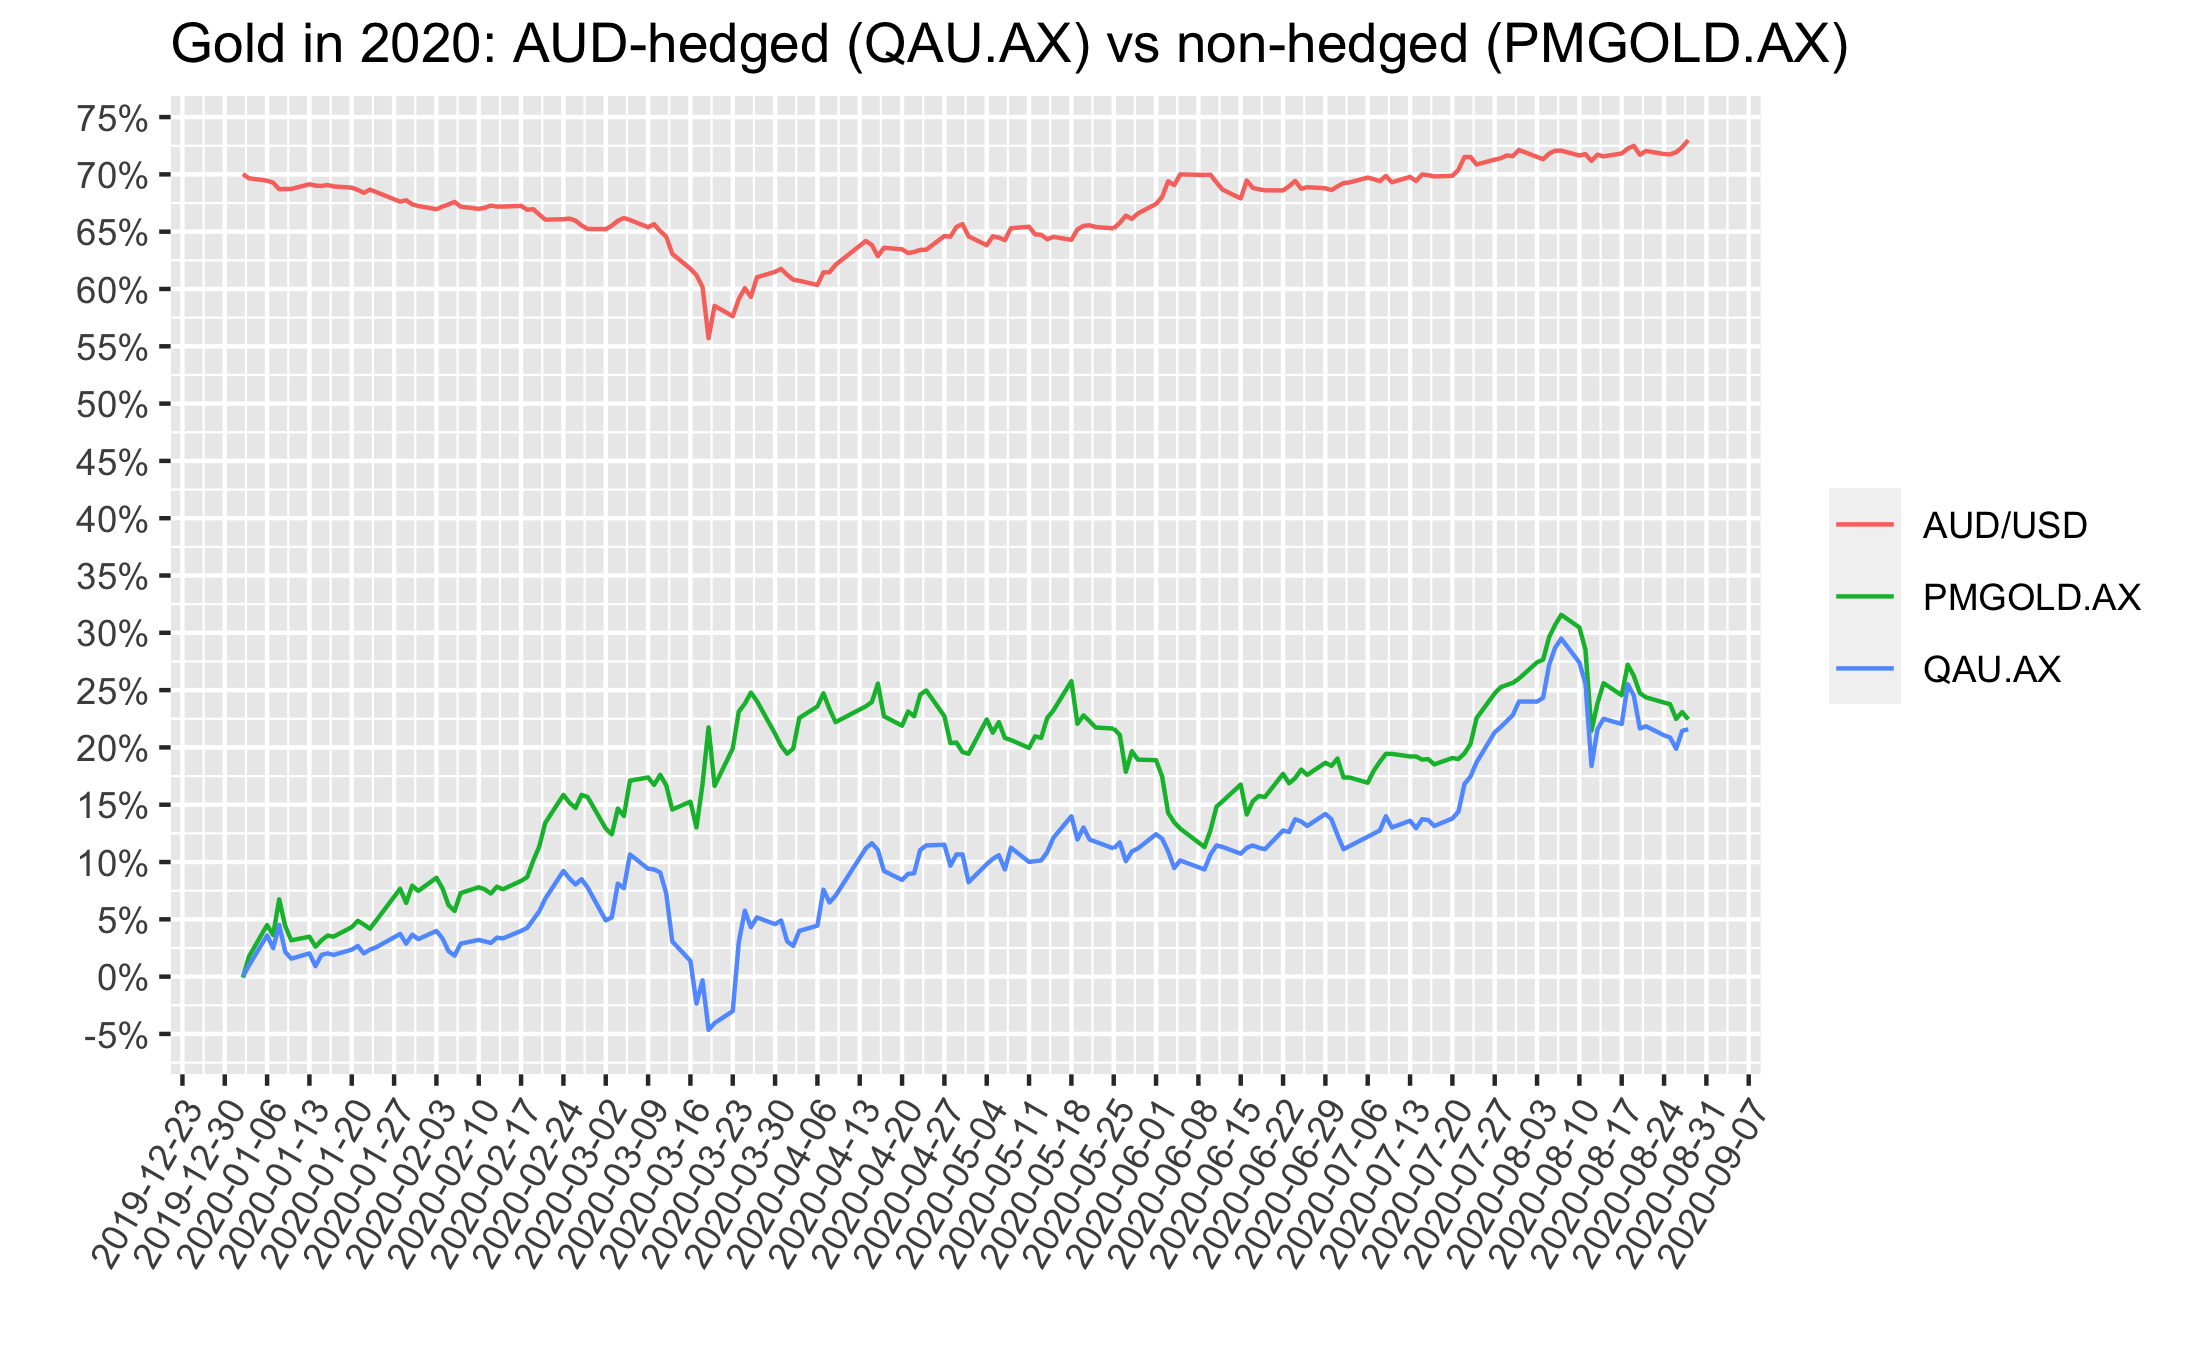
Since it’s too hard to accurately predict how AUD/USD fx rates will move going forward, holding half of each QAU/PMGOLD means one would not have to worry about this - it eliminates some timing risks, related to AUD/USD fx.
Below are real examples on the timing/currency point.
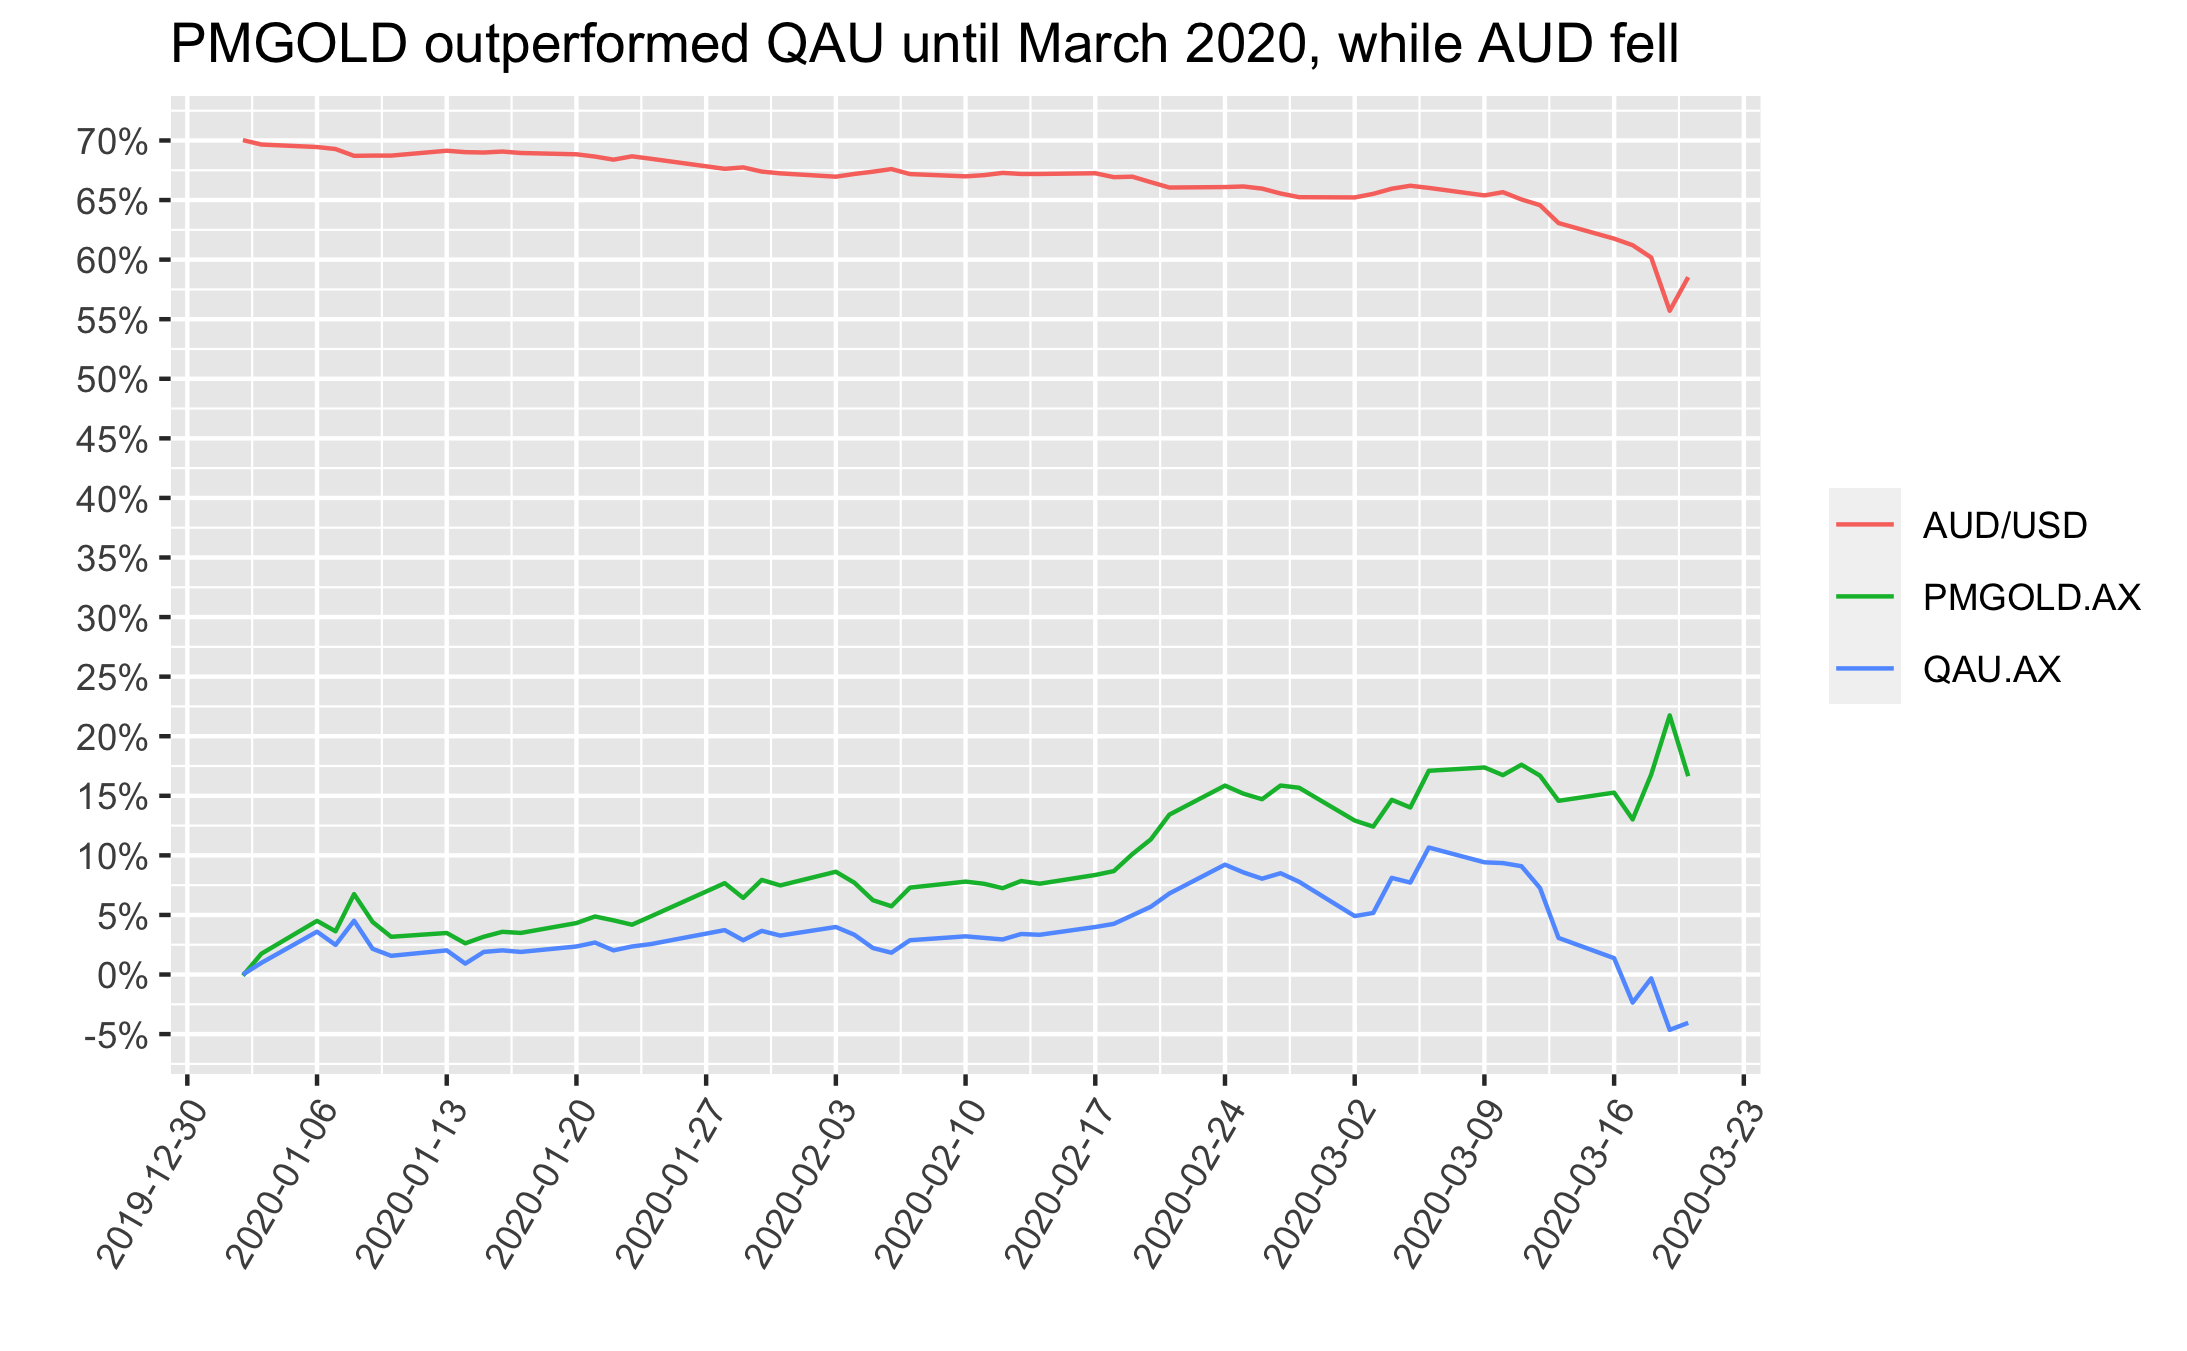
First, if one happened to purchase a gold ETF via the ASX in Jan 2020 and then needed to sell for some during March 2020, the returns were great if they picked PMGOLD and poor if they picked QAU. This difference driven by the AUD/USD fx rate, as depicted below:
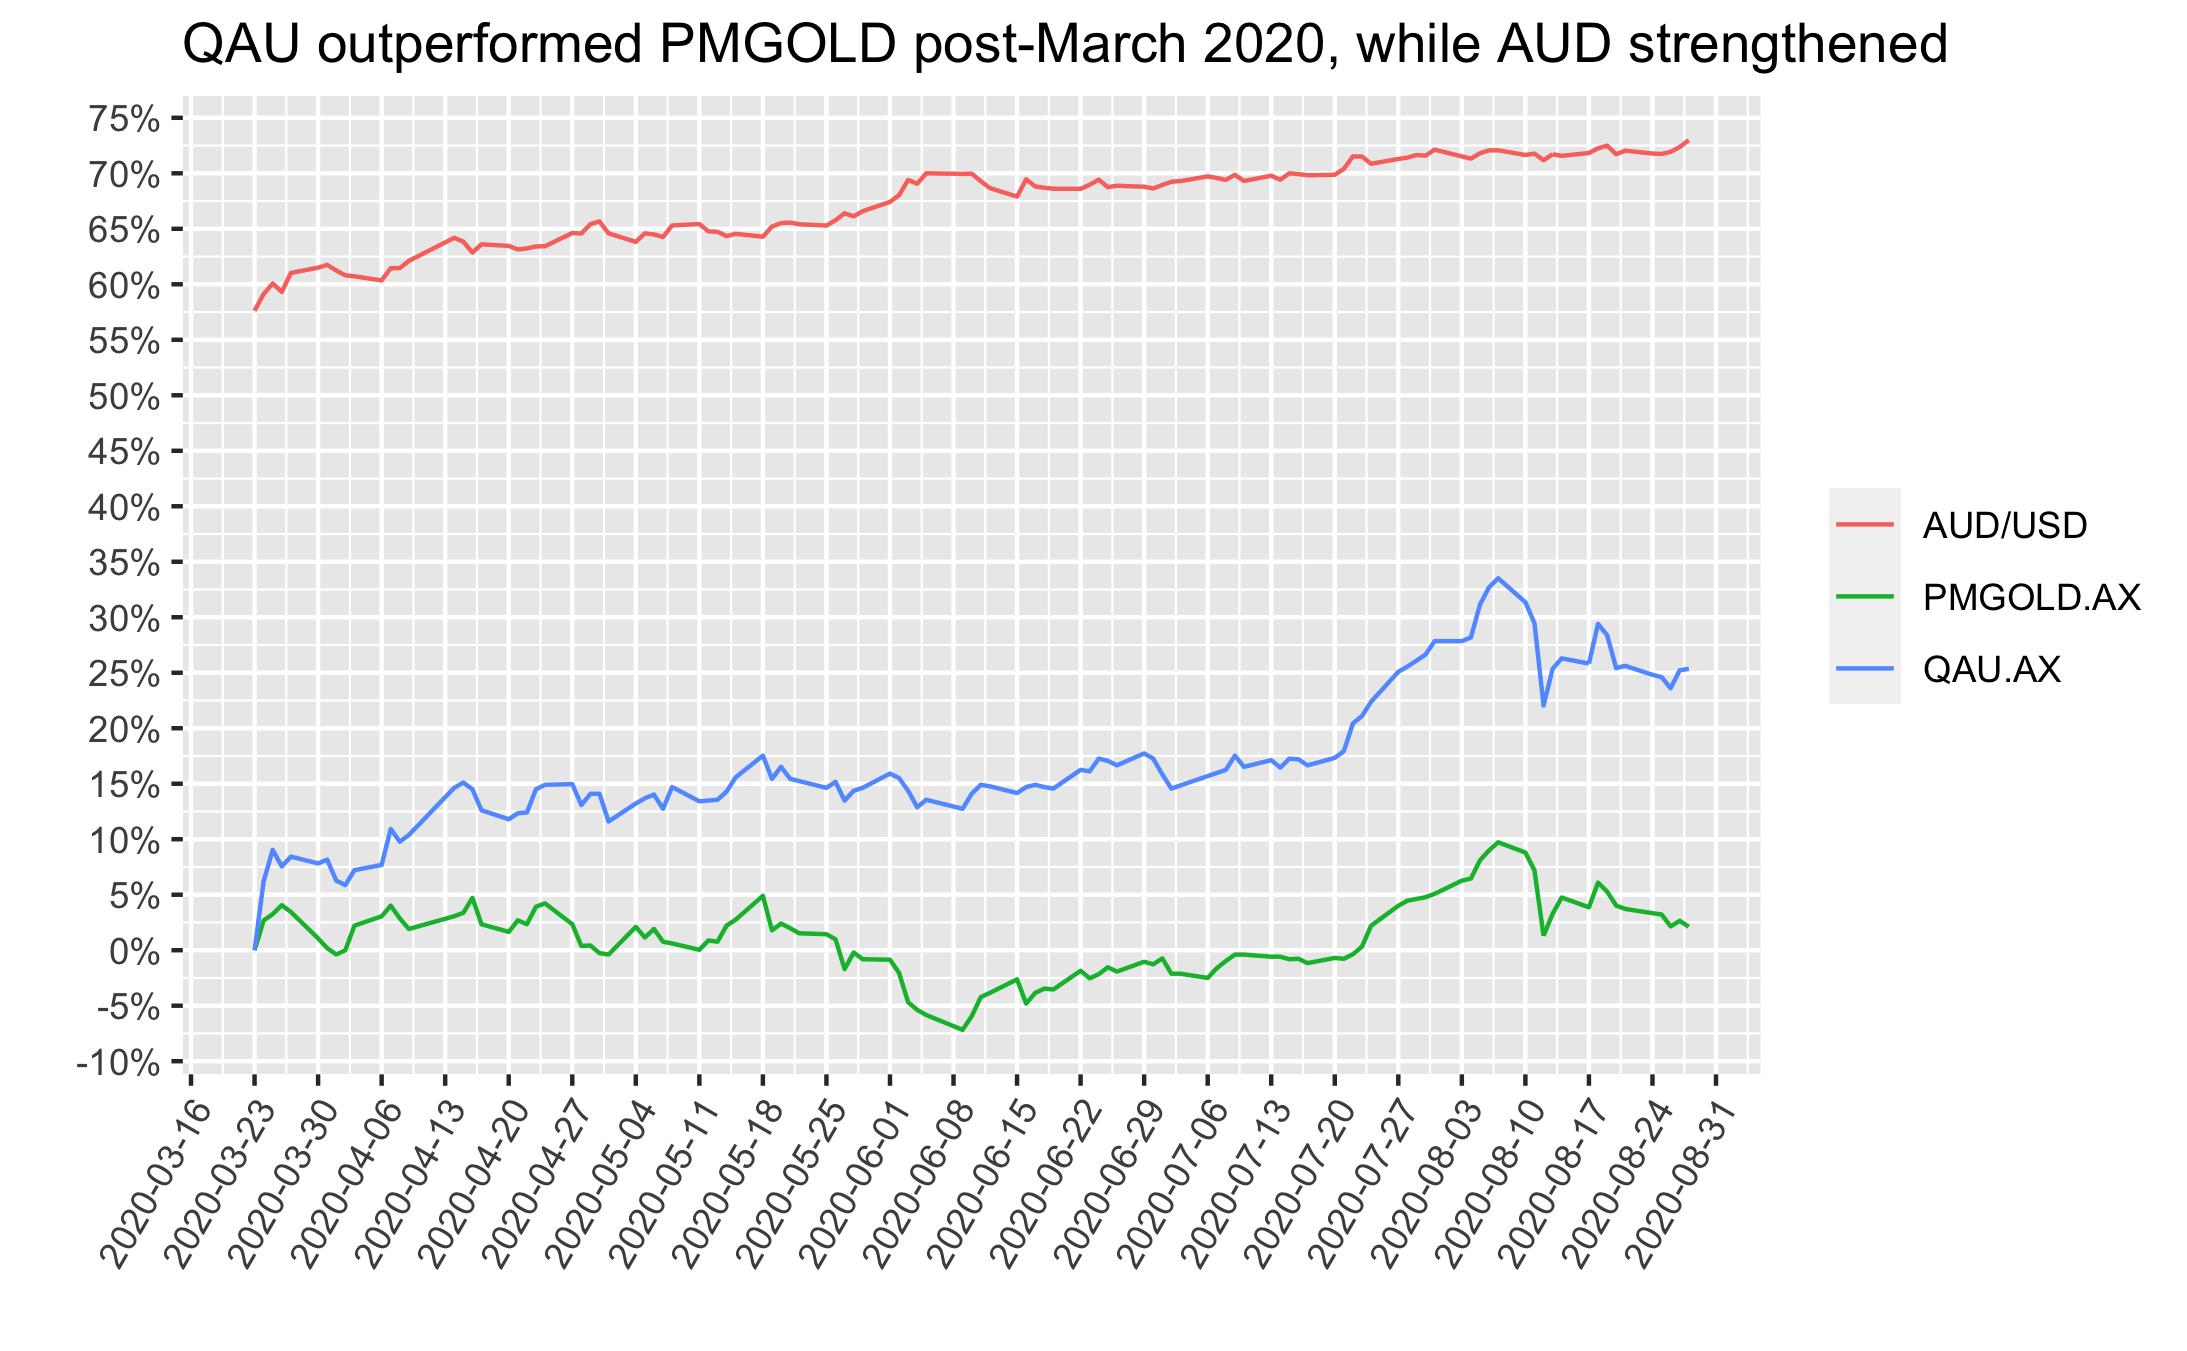
On the other hand, if one happened to purchase mid-March 2020 and needed to sell now then results are the opposite - returns would have been great if they’d picked PMGOLD and poor if they picked QAU. Again, the difference driven by the AUD/USD fx rate, as depicted below:
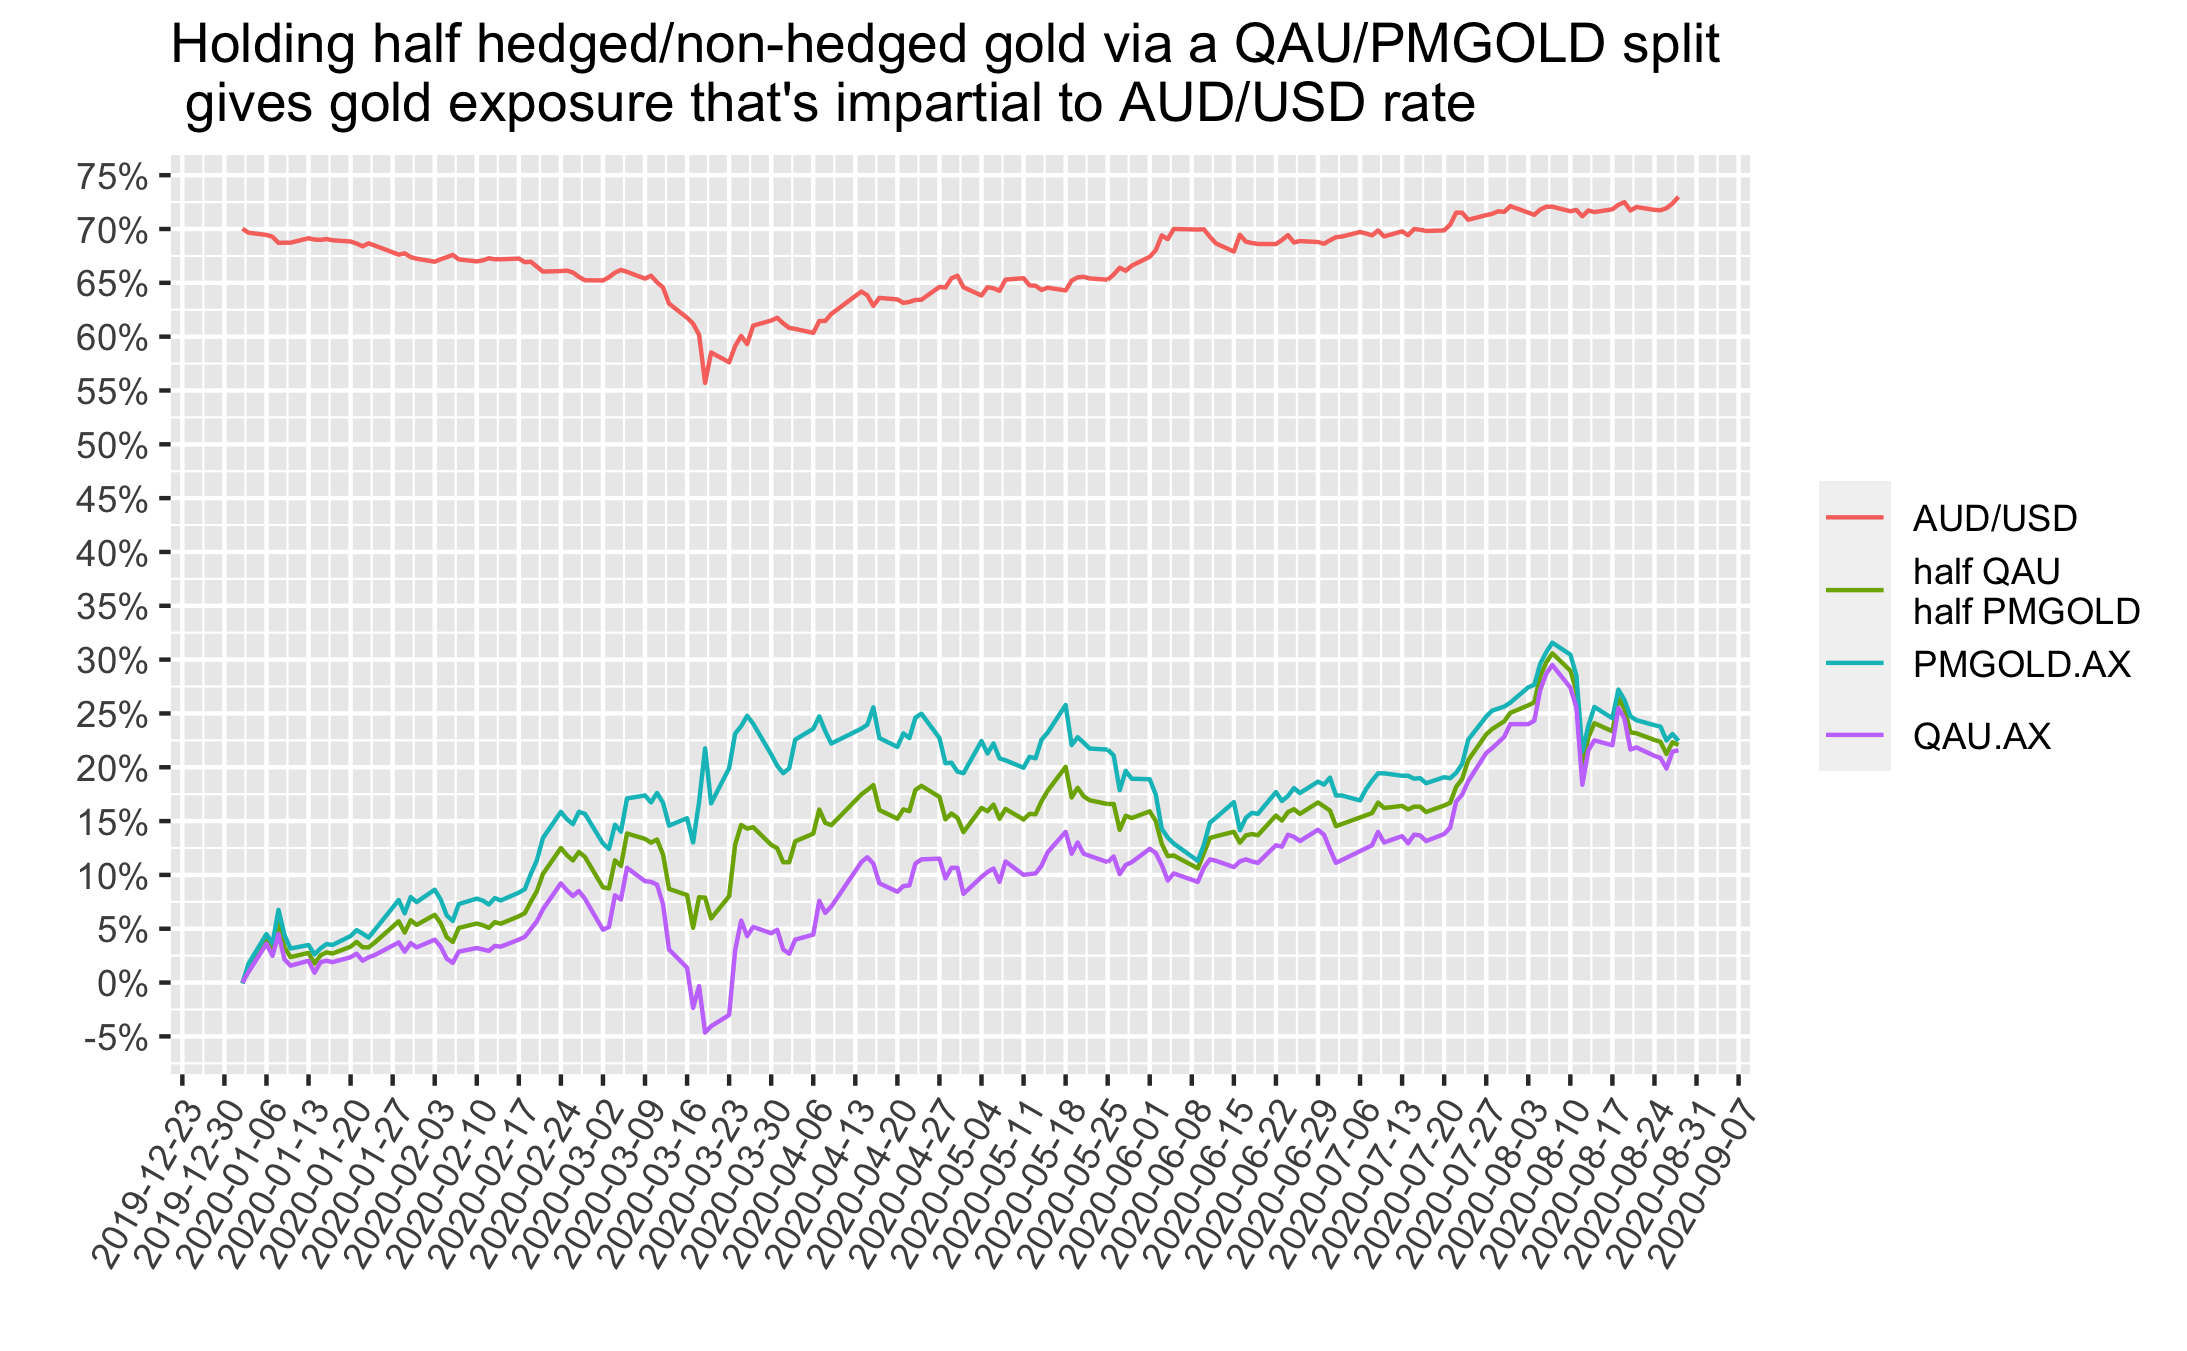
The final figure below shows the time period from the start of 2020 to now, but includes an extra line with the returns of holding half QAU/PMGOLD. This half AUD-hedged/non-hedged approach gives a way for Aussies to get gold exposure that does not have AUD/USD timing risk.
I’ll provide my code used to get/wrangle the data and make the figures here https://github.com/DanielPNewman/gold
12 Jul 2020
My Sunday night thoughts on the topic.
The question
I was wondering if there isn’t an alternative to nominal bonds for diversifying against downturns in equities, that also gives protection against inflation1. Since nominal bond yields across developed economies are now so close to zero, coupled with ongoing extreme amounts of money printing by central banks to combat the covid19-related economic slowdown, there is limited upside left in holding the large exposure to nominal bonds outlined in our previous portfolios2.
So I asked the question, could I replace some (or all) of our nominal bonds with Inflation Linked (IL) bonds, while still holding a balanced asset mix diversified across currencies, geographies and asset classes?
The answer
My analysis found that the simplest way to deal with this was to keep my equities, commodities, gold and emerging markets target weights as they are, and simply switch nominal bonds to IL bonds instead. I thought of this idea after watching this video from Bridgewater. The whole video is excellent, but the last few mins (from around 27:45 onwards) lay out my motivations, succinctly.
I ran historic data through my volatility budgeting algorithm to figure out the new weights needed to do this and still keep the whole portfolio balanced in line with the all-weather principle. Interestingly the asset class weights come out neatly such that all that is required for this tactical change is to switch some (or all) nominal bonds to IL bonds. All other assets’ weights could stay basically as they were. The resulting asset mix could look very much like that in Table 1.
Table 1. A global ESG filtered all-weather portfolio that uses inflation linked (IL) bonds in place of nominal bonds3
| Ticker |
Portfolio Weight |
Asset Class |
Region |
Exchange |
| VESG |
18% |
Equities |
International (Developed Markets) |
ASX |
| FAIR |
6% |
Equities |
Australian |
ASX |
| VGE |
2.5% |
Equities |
International (Emerging Markets) |
ASX |
| WIP |
10% |
Inflation linked Government Bonds |
International (Developed Markets) Ex. US |
NYSE |
| SCHP |
20% |
Inflation linked Government Bonds |
US |
NYSE |
| ILB |
7% |
Inflation linked Government Bonds |
Australian |
ASX |
| GSBE47 |
4% |
Government Bonds (long term) |
Australian |
ASX |
| GGOV |
10% |
Government Bonds (long term) |
International (Developed Markets) |
ASX |
| IHEB |
6.5% |
Emerging Market Credit |
International (Emerging Markets) |
ASX |
| PMGOLD |
8% |
Gold |
Universal |
ASX |
| DBC |
8% |
Commodities |
Universal |
NYSE |
The notes
1 Previously, when equity markets have dropped, central banks have lowered interest rates to stimulate their economies, thus driving up bond prices which has counterbalanced the short-term downturn in equities to smooth out the ride in our volatility balanced portfolio. But now that interest rates are basically at 0%, this once trusty simulative lever of lowering interest rates is no longer going to be effective to offset drops in equity markets. So, what do we expect countries to do next time equity markets drop? For one thing, monetary policy is likely to get more extreme in terms of printing money. This extreme increase in money printing brings another risk for anybody holding large % of nominal bonds – inflation. Since bonds hold a promise to pay back their face value in cash, high inflation rates erode the purchasing power of cash and thus decrease the value of nominal bonds. IL Bonds correct for this, by increasing face value in line with inflation.
2 Amy and I made a number of posts since our August 2019 blog outlining a defensive portfolio to weather economic storms. The follow-up posts in April 2020, after the market shocks caused by COVID 19, showed that both the original solution and our evolved solution of an Environmental, Social, and Governance (ESG) filtered version of this strategy performed exactly as designed and weathered the COVID 19 market storms well, for which we were very happy and grateful.
3 There is currently no way to get global IL bond exposure via the ASX, so we use TIP and WIP via the NYSE for our global IL bond exposure. Access to the NYSE also means we can use DBC for commodities exposure which we like since this ETF is far more liquid than the commodities ETF available on the ASX, ‘QCB’, which has very low trading volume leading to liquidity risk.
12 Apr 2020
How has our all-weather strategy held up so far in the COVID-19 epidemic?
An Update
A number of people have asked how our investment strategy - outlined in our August 2019 blog post called Global “all-weather” portfolios - investment adventures of an Aussie couple - has fared in response to the Covid-19 epidemic.
The August 2019 blog shared our research into a strategy designed to perform relatively well in any economic environment. We are very glad that we did this research and took action based on our findings. It has served us well in these turbulent times!
Rather than replying to each person individually, Amy and I decided we’d do 2 things: 1) I’d write this update adding the latest data to the performance plots described in our original blog post, to show how that has fared during the time since we first published it; and 2) Amy would write a quick post showing our evolved solution executing an Environmental, Social, and Governance (ESG) filtered version of this strategy as a single ESG portfolio diversified across global geographies and risk balanced across asset classes.
But below are the updated versions of the plots from our original blog post - with new data added to cover the 8 months since we published it:
The original domestic Australian asset mix since we published it in Aug 2019
 The domestic Australian “All-Seasons” and “Our Version” portfolios have had superior returns and smaller drawdowns compared to 100% equities via the ASX 300 accumulation index, since we published the asset mix in Aug 2019. The relevant securities and weights for each of these portfolios are shown in Table 2 of our original blog post.
 Historical performance simulations of domestic Australian “All-Seasons” and “Our Version” portfolios show these portfolios had considerably smaller and less frequent drawdowns compared to 100% equities via the ASX 300 accumulation index. Although the overall return of 100% equities (ASX 300) was the highest, one could have put money in/taken it out of All-Seasons and Our Version at any time since 2001 without suffering unpalatable losses. The same cannot be said for the ASX 300 which, on five occasions since 2001 has suffered drawdowns large enough to be unacceptable for our situation. The relevant securities and weights for each of these portfolios are shown in Table 2 of our original blog post. ETFs for the required asset classes were not available prior to 2012 so the performance shown is based on their underlying indexes. Historical bond performance was derived from futures price indices with coupon payments accumulated semi annually at historical 10 year yield rates. The commodities performance reflects underlying SPGCLEP commodities index only, excluding potential ETF distribution payments and currency hedging effects. We painstakingly sourced this historic index data from a variety of free sources and can’t guarantee its accuracy - if anybody reading this has access to a proprietary data source they’d like to share with us, please get in touch!
Note these simulated results do not include brokerage fees and assumes the desired portfolio balance is maintained throughout, whereas in practice the portfolio would be rebalanced periodically. Simulated historical performance results have inherent limitations since unlike an actual performance record, simulations do not reflect the cost of trading or the impact of actual trades on market factors such as volume and liquidity.
The original foreign asset mix since we published it in Aug 2019
 Our Versions of the unleveraged foreign asset mix have had superior returns and also smaller and less frequent drawdowns compared to 100% “Global Equities”. The relevant securities and weights for each of the portfolios depicted here are provided in Table 2 of our original blog post.
 Historical performance simulations of “Our Version” of an unleveraged global All-Weather portfolio show it had lower overall returns but also considerably smaller and less frequent drawdowns compared to 100% “Global Equities”. Although 100% global equities gave a higher overall return over a longer period, our time-horizon and needs currently favour limiting drawdowns over maximising returns. The relevant securities and weights for each of the portfolios depicted here are provided in Table 2 of our original blog post.
Note these simulated results do not include brokerage fees and assumes the desired portfolio balance is maintained throughout, whereas in practice, the portfolio would be rebalanced periodically. Simulated historical performance results have inherent limitations since unlike an actual performance record, simulations do not reflect the cost of trading or the impact of actual trades on market factors such as volume and liquidity.
An important point to reiterate is that the portfolios here are NOT the same as Bridgewater’s All-Weather. Bridgewater uses cheap leverage and sophisticated investment instruments to increase returns while still minimizing risk. These simplified portfolios we show here do not use leverage and thus have lower expected returns than Bridgewater’s All-Weather, but still reduces risk compared to 100% equities.
Our continued evolution
We wanted a single globally diversified portfolio filtered for ESG/ethical considerations and based upon the principles discussed here and in our original blog post…
So now Amy and I can share our evolved solution, executing an ESG filtered version of this strategy!
Looking forward, we’re still making good progress on figuring out how to cost-effectively leverage our lower volatility asset classes (e.g. the Treasury bonds) to have similar expected volatility/returns as equities, thus maintaining risk parity while increasing returns, like Bridgewater can. We are still ironing out more details around margin requirements, transaction costs, rebalancing, etc. and codifying our strategy into software, but it is looking very promising. So stay tuned for the future instalments!
 This joke from our original blog post has proved to be telling since we published it in Aug 2019!
23 Mar 2020
I have just finished a long holiday vagabonding around Asia and South America (Brazil) with my wonderful wife, Amy.
The trip was planned to last 11 months, but we cut it short to 9.5 months due to the Covid-19 epidemic. We have just arrived back in Melbourne and have started a compulsory 14-day self-isolation.
I felt like taking a few minutes to reflect and write a short blog looking back over the last 9 and half months.
And what an amazing 9.5 months it has been! We were lucky enough to visit diverse cultures across 11 countries (Singapore, Sri Lanka, Malaysia, Vietnam, Thailand, Philippines, Taiwan, New Zealand, Japan, Spain, Brazil) and get to know (and reconnect with) many wonderful people. We experienced so much amazing nature, sights, foods and people, too much to list here.
But on reflection, the trip wasn’t all about touring, eating and hanging out with new and old friends – I also made some large achievements and learned productive life skills along the way. I will try to take stock of them in the list below:
- learned to surf
- created a personal investment strategy
- taught Amy some programming
- learned to meditate as a habit
- made a daily 12 min exercise routine a habit
- learned to speak a little Mandarin Chinese
- read excellent books
- walked amazing hikes
- worked on marriage foundations
- skied powder snow
- reconnected with old friends/colleagues living abroad
- figured out my personal strengths and weaknesses
- created a personal mission statement
It feels good to think back on some of these achievements and skills that I gained while we travelled around Asia and Brazil. I feel ready to be back home in Australia and enjoy the next chapter of life!
12 Nov 2019
Amy works as a Lawyer and environmental sustainability consultant. She wanted to know some programming for data analysis/communication to help uncover and share useful environmental sustainability insights. I work as a Data Scientist so taught her some of my trade’s tools to help set up her own github account and then learn the R, Git and *nix commands necessary for her to:
- pull environmental data from a google sheets URL,
- process it,
- visualise it,
- knit the results to
markdown format
- and publish the results on her own github pages blog.
This was a satisfying and educational process for us both:
-
Amy learnt the data processing/visualisation skills needed to uncover and communicate environmental sustainability insights (more on those below).
-
I learnt about some fascinating ideas about how Project Drawdown’s solutions apply to the 17 Sustainable Development Goals (SDGs).
And it led to publishing an excellent and thought provoking post: Project Drawdown solutions meet many Sustainable Development Goals. Certainly worth a read!
On reflection, I encourage all data scientists to spend a little time teaching others (who want to learn) some of the basic tools of our trade. This can empower people (especially those from more “traditional” fields such as law) with new tools to explore and communicate data. It can only be a good thing if the ever increasing volumes of digital data are more often explored through multiple lenses of diverse areas of domain expertise.
Amy said that “for me, programming for data analysis and communication was such an unknown area that it was hard to know where to start. So to have somebody who can walk you through some of the basics to get you started is really empowering!”